Importance of Event Tracking and Analytics
Event Tracking and Analytics refer to the processes of monitoring user interactions within digital systems and analyzing the resulting data to understand behavior, performance, and impact. Events can include clicks, logins, form submissions, or feature usage, each providing insights into how people engage with tools and services. Their importance today lies in enabling organizations to design more responsive systems and measure effectiveness in real time.
For social innovation and international development, event tracking and analytics matter because mission-driven organizations must demonstrate outcomes and continuously adapt to user needs. By tracking interactions, they can improve usability, ensure accessibility, and align digital services with community priorities.
Definition and Key Features
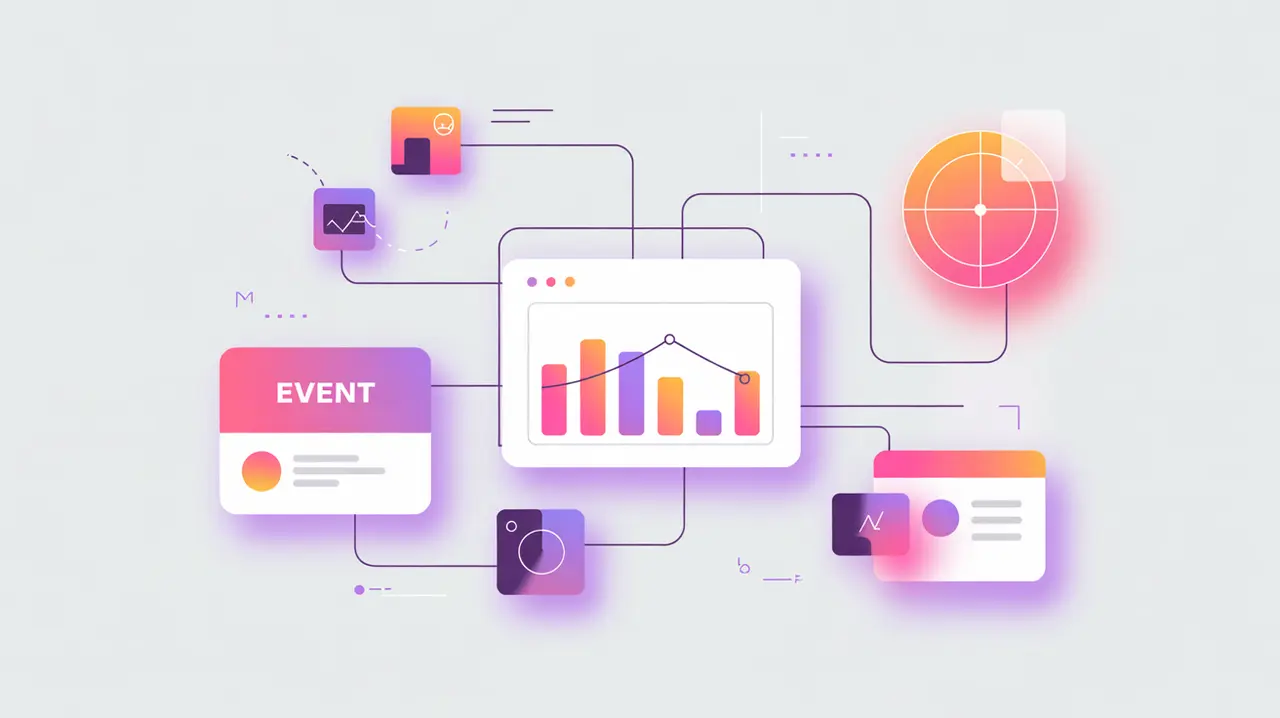
Event tracking involves instrumenting applications to capture specific actions taken by users. Analytics platforms, such as Google Analytics, Mixpanel, or Matomo, process this data into dashboards and reports that highlight trends and patterns. Events can be tagged with metadata like user ID, location, or device type, enabling more detailed insights.
This is not the same as survey-based evaluation, which relies on self-reported data. Nor is it equivalent to system logs, which capture technical performance but not user intent. Event tracking focuses on structured, behavior-level data that reflects actual usage.
How this Works in Practice
In practice, organizations set up event tracking by embedding tracking codes or SDKs into their applications. Analytics dashboards allow teams to measure engagement with specific features, test hypotheses, and identify bottlenecks. Advanced tools integrate cohort analysis, funnel tracking, and predictive analytics to forecast outcomes. Privacy and compliance requirements, such as GDPR, must be carefully managed to protect user rights.
Challenges include data overload, the difficulty of interpreting causality, and risks of excluding marginalized groups whose digital interactions may not be fully captured. Strong governance and equity-focused design are critical to ensure that analytics reflects the diversity of real-world use.
Implications for Social Innovators
Event tracking and analytics are vital for mission-driven organizations. Health platforms can monitor patient engagement with telemedicine portals to improve service delivery. Education initiatives can track student participation in digital lessons to adapt content in real time. Humanitarian agencies can analyze usage of crisis information tools to optimize response. Civil society groups can use analytics to measure the reach and impact of advocacy campaigns.
By turning user interactions into actionable insights, event tracking and analytics help organizations design more effective, inclusive, and accountable digital systems.