Importance of the Gross Margin Ratio
The gross margin ratio measures how much revenue remains after covering the direct costs of delivering programs, services, or products. It matters because it shows whether the organization generates enough surplus from core activities to support overhead, fundraising, and reserves. For nonprofits, this ratio is most relevant in contexts where earned income or fee-for-service activities are part of the model. In social innovation and international development, it is particularly important for organizations running social enterprises, training programs, or cost-recovery services.
Definition and Features
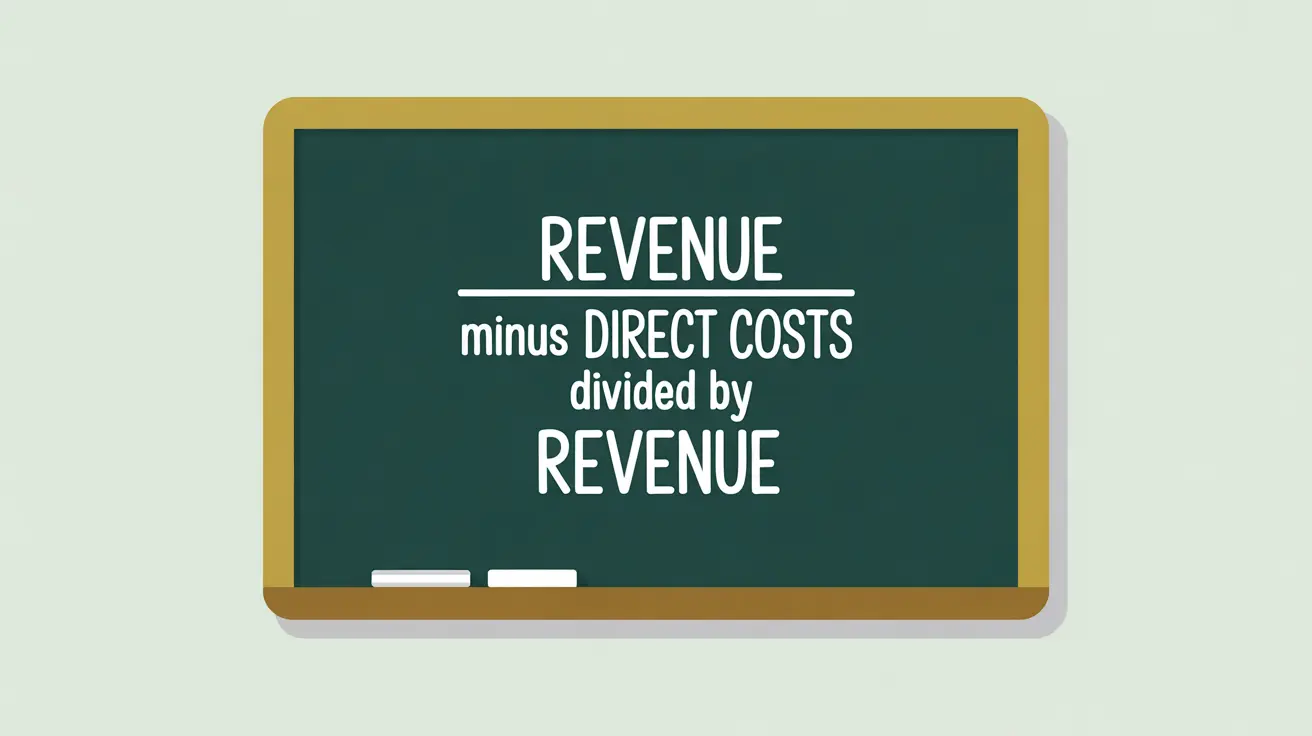
The gross margin ratio is defined as:
Total Revenue minus Direct Costs divided by Total Revenue.
Key features include:
- Efficiency Measure: shows how much revenue is available after paying for direct costs.
- Benchmark Use: higher ratios indicate greater capacity to support overhead and reserves.
- Applicability: most relevant for nonprofits with fee-based or enterprise components.
- Decision Utility: helps boards evaluate the sustainability of program or enterprise models.
How This Works in Practice
If a nonprofit generates $5 million in revenue from a social enterprise and incurs $3.5 million in direct costs, its gross margin ratio is 0.30 (30%). This indicates that 30% of revenue is available for overhead, reserves, or reinvestment. Leadership might analyze trends in this ratio to assess whether pricing, efficiency, or cost controls need adjustment. For example, if margins are shrinking, the organization may need to review procurement, staffing, or pricing strategies.
Implications for Social Innovation
For nonprofits in social innovation and international development, the gross margin ratio provides insight into whether enterprise models are contributing effectively to sustainability. A strong ratio shows that the nonprofit can generate resources beyond donor funding, strengthening independence and flexibility. A weak ratio may indicate that the enterprise model is draining resources rather than supporting the mission. By tracking and communicating this measure, nonprofits can demonstrate to funders that social enterprise activities are aligned with sustainability and are not compromising core mission delivery.