Importance of the Restricted versus Unrestricted Revenue Ratio
The restricted versus unrestricted revenue ratio measures the balance between funds that must be spent on specific donor-approved purposes and funds that can be used flexibly for general operations. It matters because unrestricted revenue is essential for sustainability, innovation, and investment in infrastructure, while restricted funds often dominate nonprofit budgets. For boards and donors, this ratio provides insight into how much flexibility the organization has to manage growth, cover overhead, and respond to emerging opportunities. In social innovation and international development, where grants are often tightly restricted, this ratio is a critical signal of organizational agility.
Definition and Features
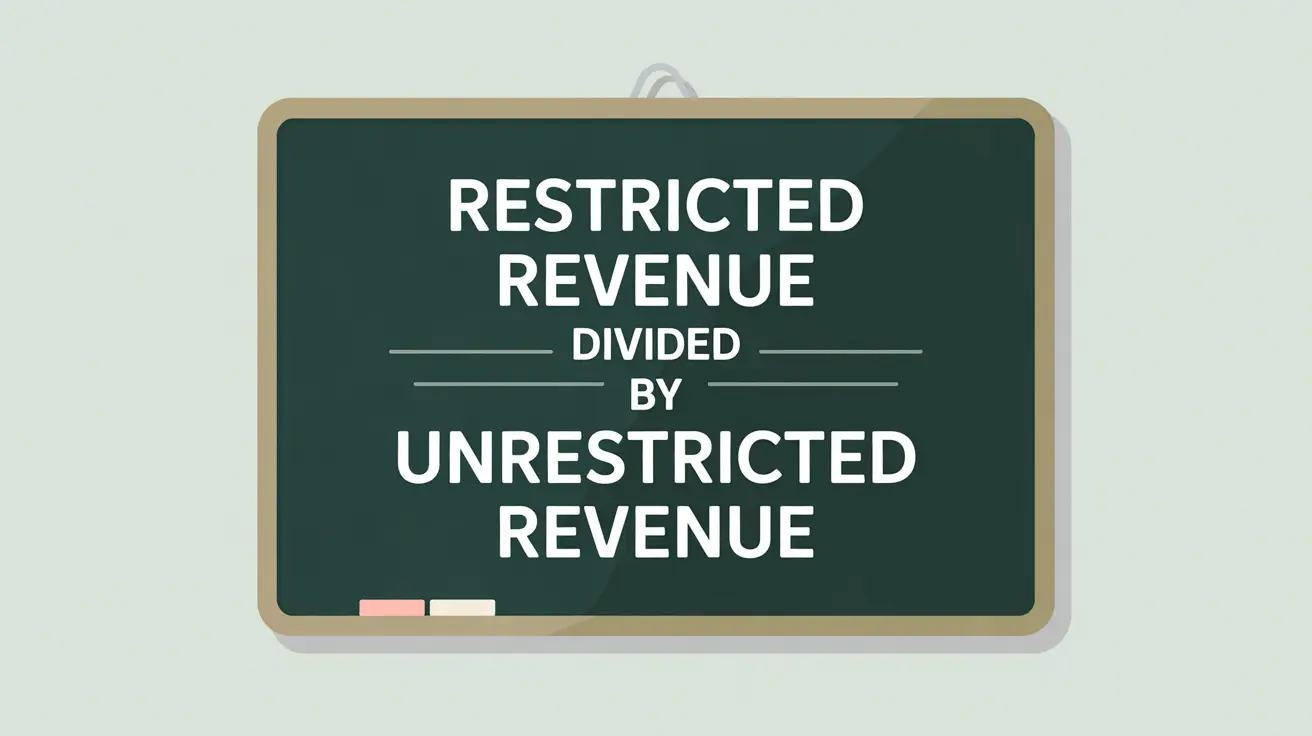
The restricted versus unrestricted revenue ratio is defined as:
Restricted Revenue divided by Unrestricted Revenue.
Key features include:
- Flexibility Indicator: shows the balance between donor-controlled and discretionary funding.
- Risk Assessment: higher ratios may signal vulnerability if too much of the budget is locked into restricted projects.
- Board Oversight: helps boards decide whether to prioritize unrestricted fundraising.
- Donor Communication: a transparent way to show the need for general support alongside restricted funds.
How This Works in Practice
If a nonprofit has $12 million in restricted revenue and $3 million in unrestricted revenue, the ratio is 4.0. This means for every unrestricted dollar, there are four restricted dollars. While restricted grants allow the nonprofit to fund specific projects, leadership must find ways to grow unrestricted support to cover administration, systems, and innovation. Boards often use this ratio to frame conversations about reserve-building, major donor campaigns, or social enterprise initiatives.
Implications for Social Innovation
For nonprofits in social innovation and international development, this ratio captures one of the biggest challenges: balancing donor requirements with organizational needs. Heavy reliance on restricted revenue may leave organizations unable to invest in monitoring, evaluation, technology, or staff development, which are all critical for scaling systemic change. A more balanced ratio reassures funders that the nonprofit has the flexibility to innovate and respond to crises. By tracking and communicating this ratio, nonprofits can strengthen their case for unrestricted support, building both credibility and long-term resilience.